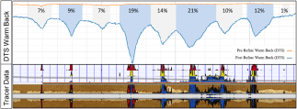
Refrac Case Study

rn.png

Figure 1: Reservoir section showing overall performance for run 1, 2 and 3.

In this case study, the effect of refraking a gas well is studied by comparing DAS and DTS data acquired using Z-System® within three different runs. Run 1 was performed before the refrac, run 2 was performed immediately after the refrac and run 3 was performed 90 days after the refrac. Surface production rates after each run 1, 2 and 3 were approximately 1x MSCF, 7x MSCF and 3.33x MSCF respectively. Figure 1 shows acoustical representation of the overall performance.

Further details can be found in SPE Paper 194338

The dots in Figure 2 indicate all the stages that were stimulated. From the chart, we can observe and accurately calculate using the Nowak method what each of the clusters took regarding stimulation. In this case we are able to see that new clusters out performed old clusters when refraking.

rn.png

Figure 2: Thermal modeling using PLATO

rn.png

Figure 3 - Qualitative modeling of well using acoustic data

To further confirm what was observed in the thermal modeling, a qualitative model using acoustic data was overlaid with high correlation present. The match further indicated that the new clusters contributed a larger proportion of the new production and outputted a higher intensity in sound ranking them as stronger producing zones then the older fractured zones.